At Sharestates we believe in full transparency. We’re already an industry leader in many respects – now, we want to make data and information transparency one of those fields. Here’s how our company stacks up – if you’d like to see additional statistics that aren’t listed here, please don’t hesitate to contact us and give us your feedback!
Loans (Submitted, Closed, Total Volume)
Total Loan App Submissions
27610
Number of Loans Closed
4206
Total Volume of Loans Closed
$3.73 Billion
Cumulative Investor Return (Annualized)
$1 Billion+
Average Gross Annualized Returns
Year
Bridge Loans
Term Loans
2015
12.27%
–
2016
11.09%
–
2017
10.98%
–
2018
10.55%
6.62%
2019
10.49%
6.21%
2020
11.06%
5.98%
2021
10.34%
5.02%
2022
10.84%
5.93%
2023
12.48%
8.4%
2023 (Q1)
12.88%
8.25%
2023 (Q2)
12.48%
8.29%
2023 (Q3)
12.80%
8.32%
2023 (Q4)
11.72%
8.74%
Average Valuation Metrics
Average Day 1 LTV
67.48%
Average ARV
56.75%
Average LTC
82.43%
Average Loan Size
$886,372
Loan Defaults & Investor Losses
# Loans 60+ Days Past Due
87
Past Due Rate*
2.06%
# Loans in Foreclosure
90
Foreclosure Rate*
2.13%
# of REO Properties
100
REO Rate*
2.37%
Total Principal Loss to Date**
TBA
*Past Due/Foreclosure/REO Rate is calculated by dividing the current number of Loans in Past Due/Foreclosure/REO by the Number of Loans Closed.
**Measured as the actual principal loss for defaulted loans that have been fully resolved.
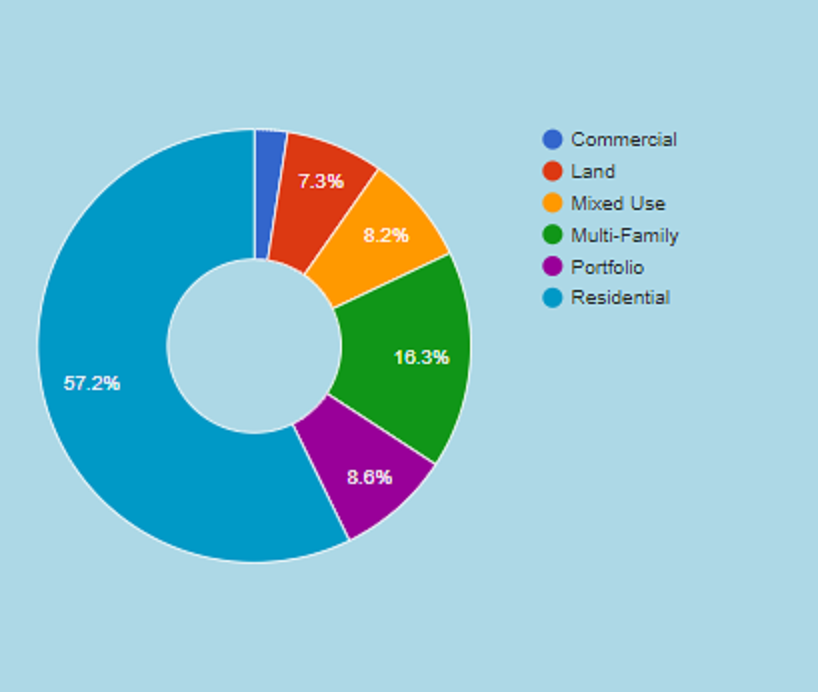
Asset Classes
(Percentage by Loan Volume)
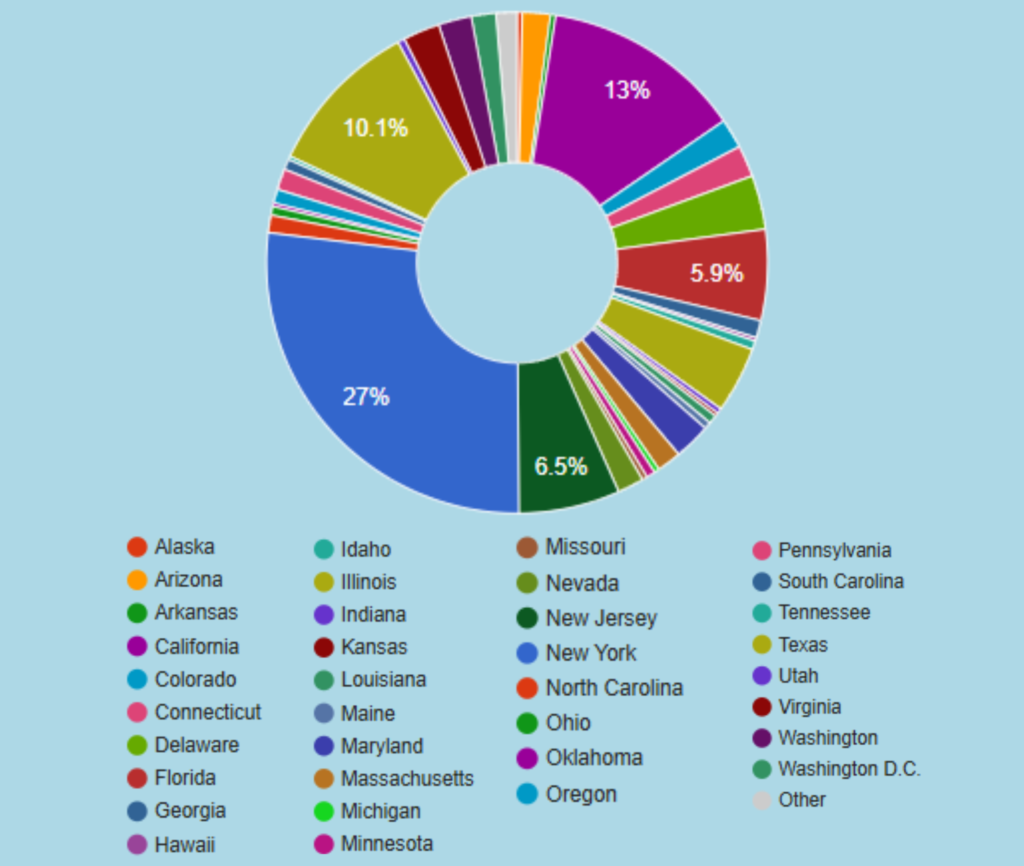
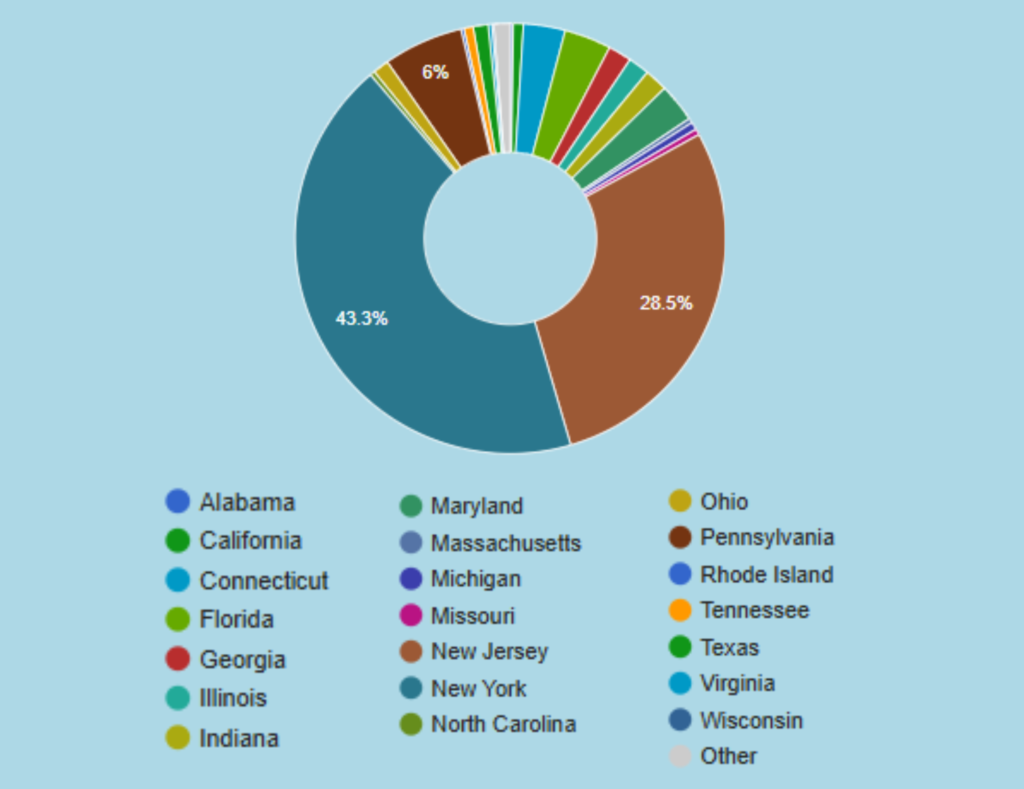
Number of states we’ve lent in (39)
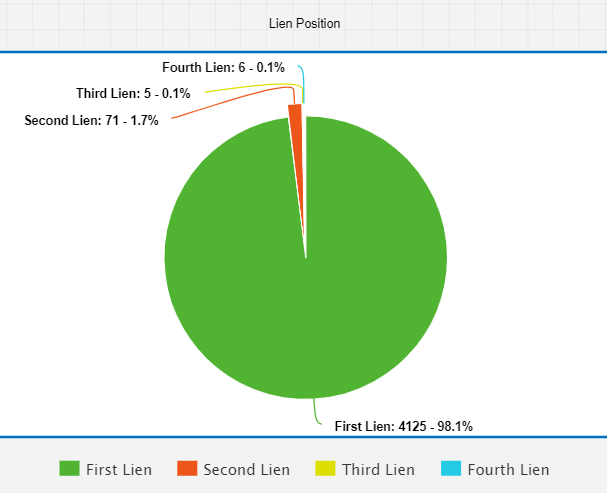
Lien Position (Percentage by Loan Volume)
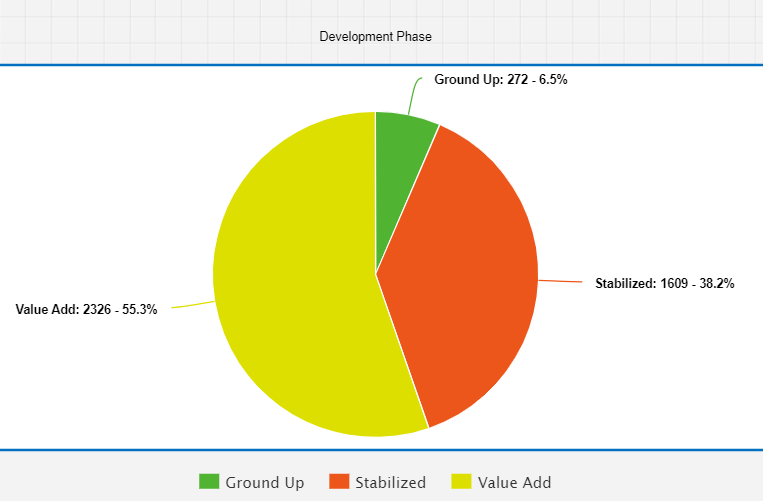
Development Phase Chart (Stabilized, Rehab and Ground Up Loans)
Investor's states (44)
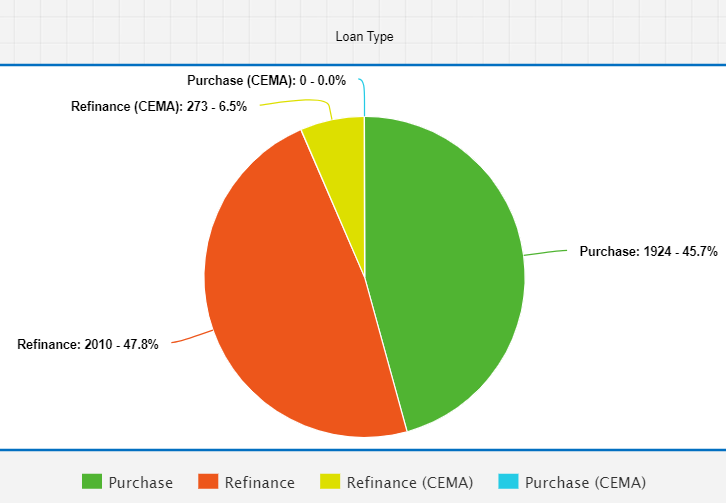
Loan Type (Percentage by Loan Volume)
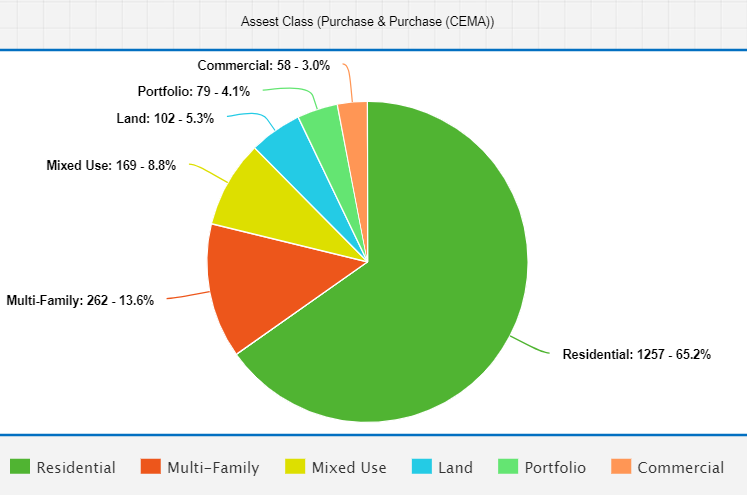
Asset Classes (Purchase) (Percentage by Loan Volume)
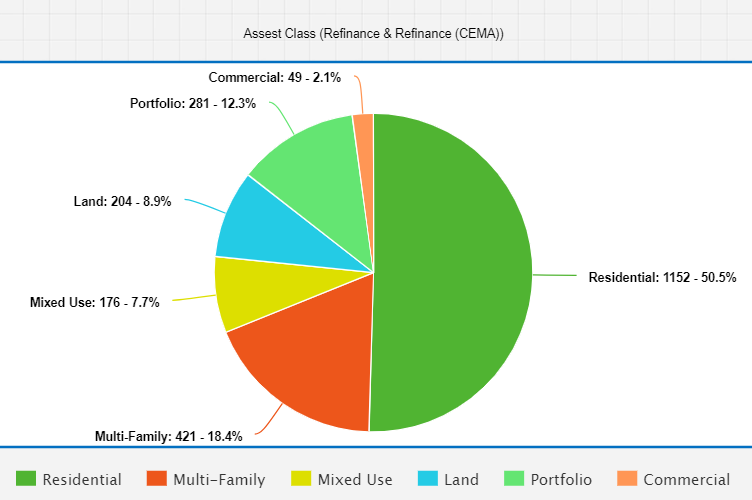
Asset Classes (Refinance) (Percentage by Loan Volume)
Total Principal returned (Loans Paid Off)
$2,28 Billion
Loans Paid Off
2684
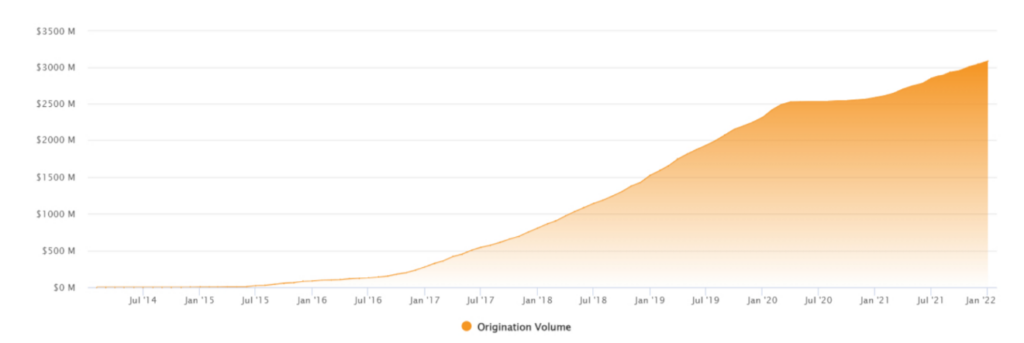
Origination Volume Growth
Repeat Borrowers & Investors, Average Investment Size