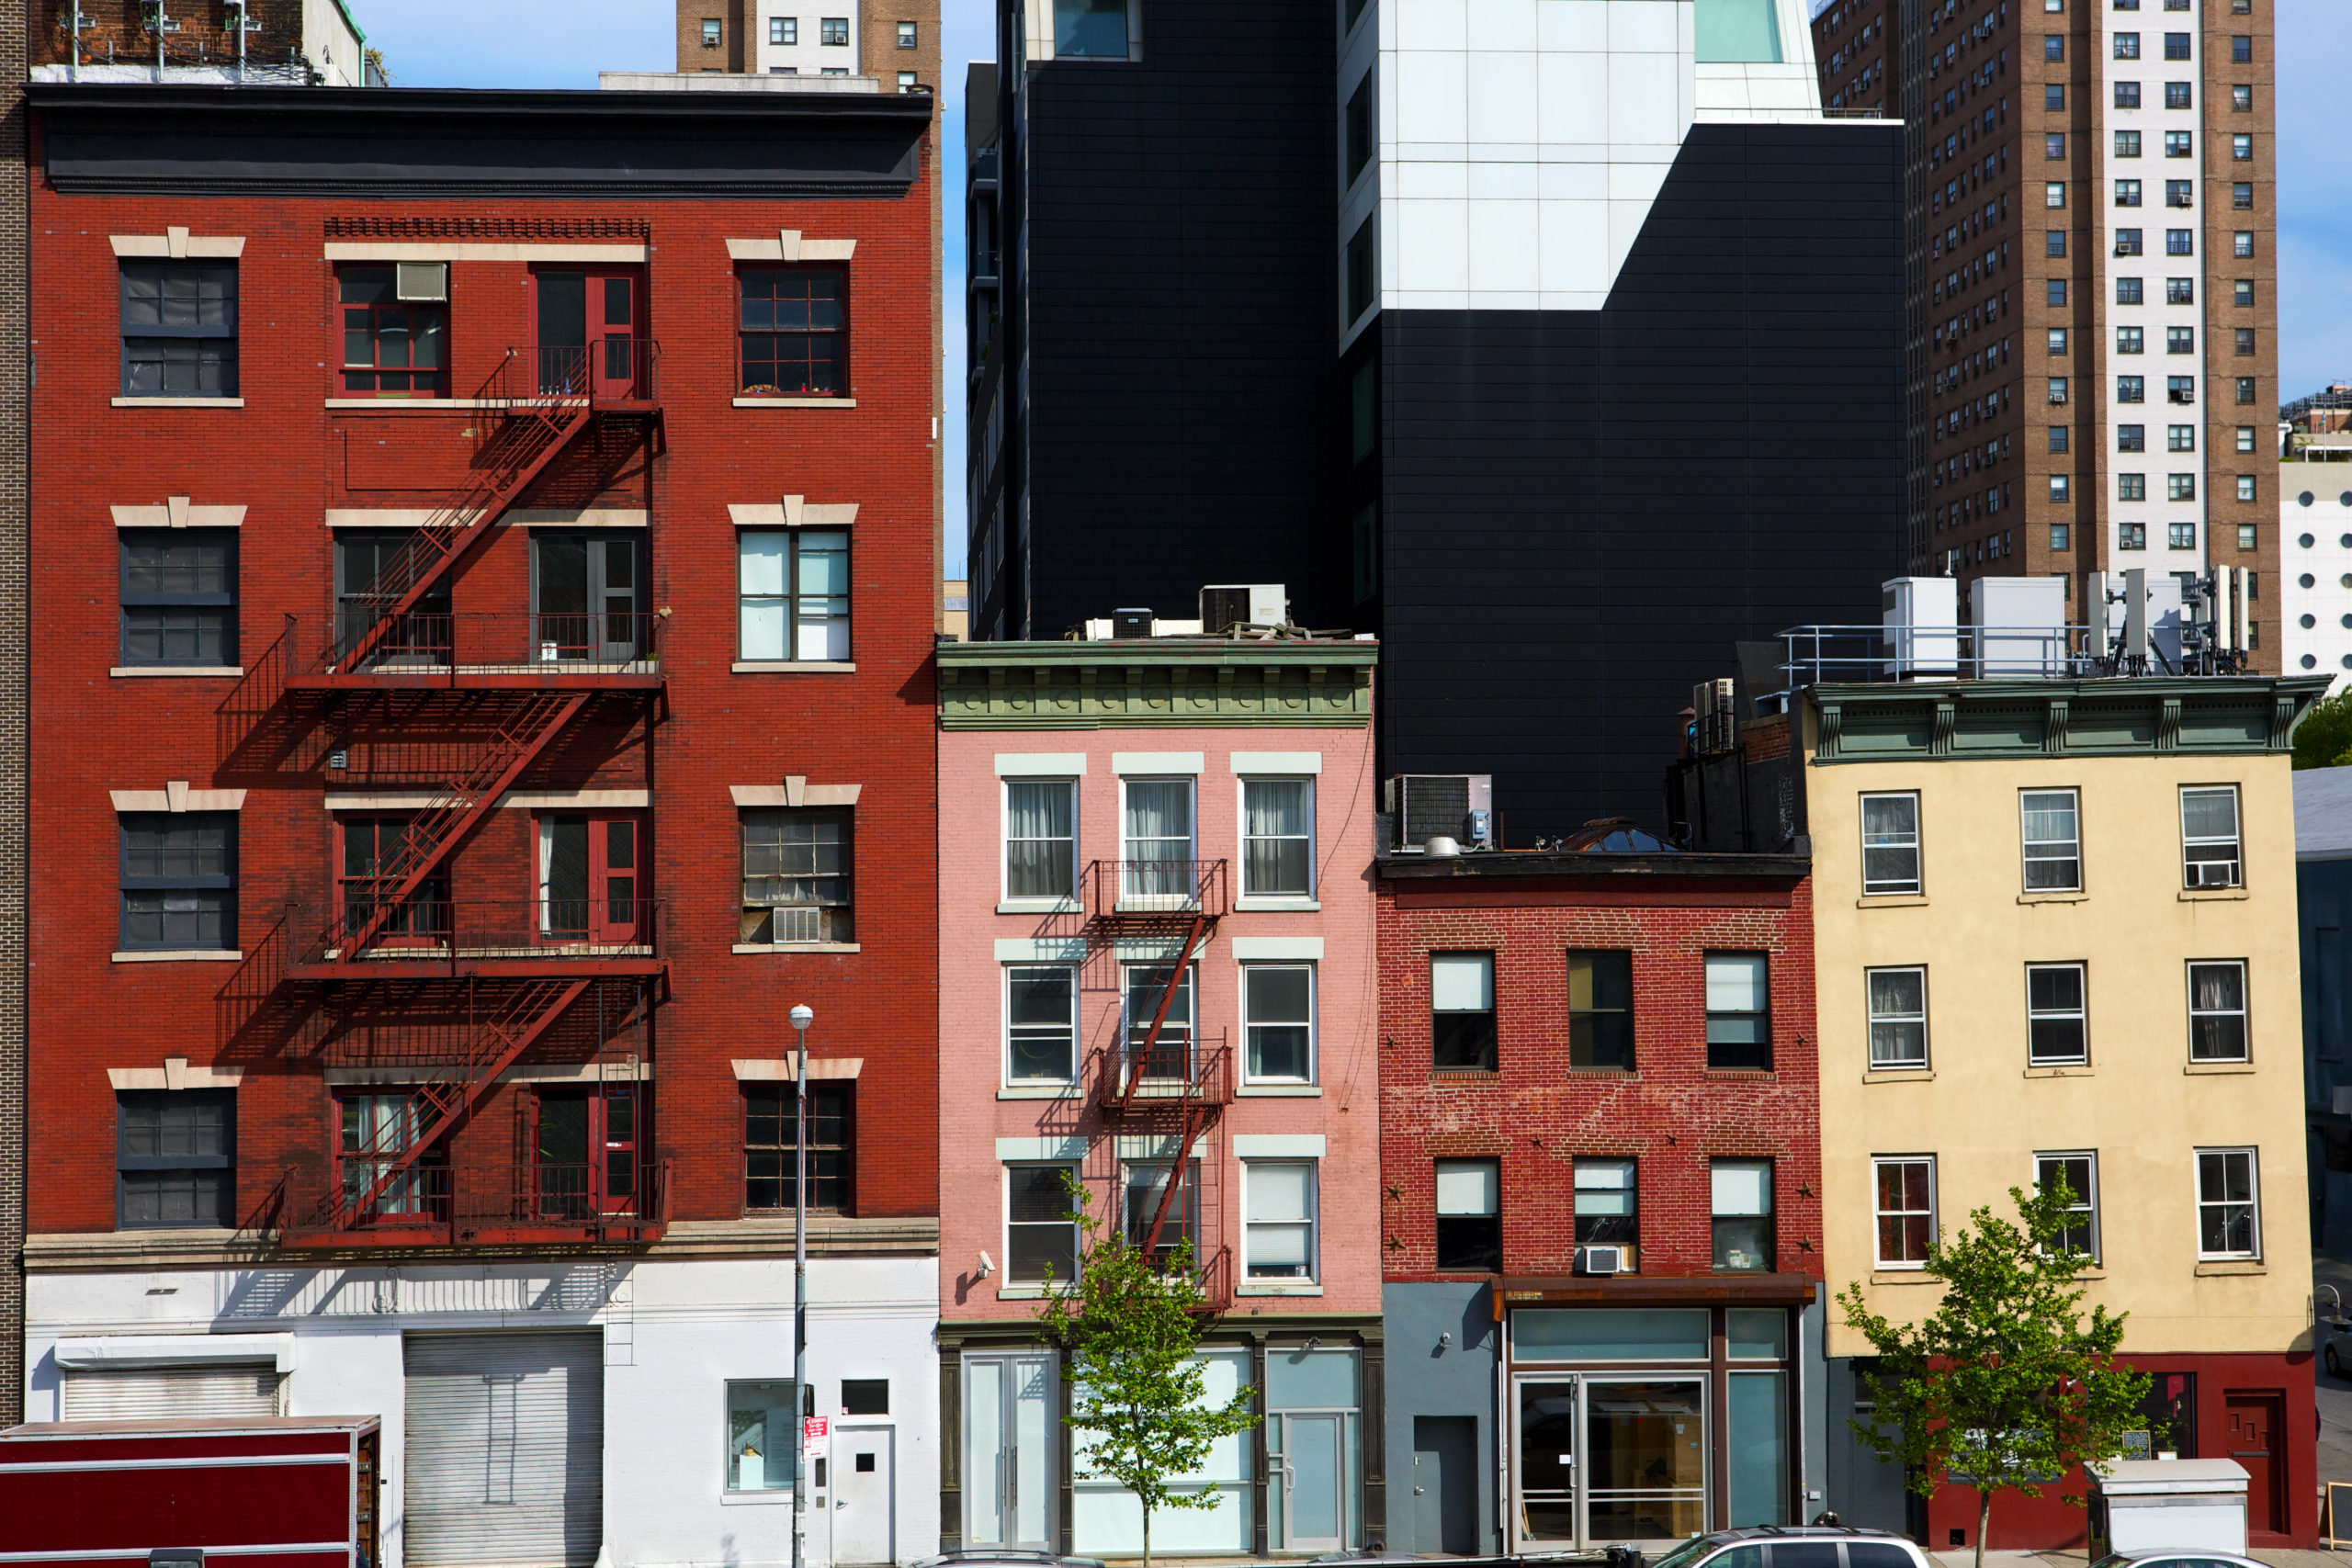
Real estate market trends for the NY metropolitan area in the most recent quarter of 2018 are showing some very interesting movement. The overall market direction is deviating significantly in different areas, providing some great investment opportunities.
One of the standout pieces of data across Manhattan, Queens, Brooklyn, Westchester, and Nassau is the inventory numbers. With the exception of Westchester and Nassau, the number of available properties for sale has increased in double-digit figures. This is a significant increase in supply that will provide a wider range of property types for investors to choose from. It also reduces the chances of bidding wars occurring, leading to more favorable price negotiations for buyers.
An interesting trend to look at with the above-mentioned increase in supply is the continuing decline in closed sales in Manhattan and Westchester, which were in the high double digits at 16.6% and 17.7% respectively. In most areas, the overall median prices are still close to or near record prices, with Queens showing the highest increase in year by year median prices of 11.6%. At the same time, Manhattan and Brooklyn have experienced a slight to a moderate decline of 1.9% and 7.5% respectively.
This summary data shows some uncertainty, especially in the higher-end markets, because of pending federal tax law changes as well as increasing lending rates. For a closer look at the trends in the most popular areas of New York, we have analyzed and broken down the data sets individually.
Manhattan
Median prices in the most expensive borough were down 7.5% year over year to $1.1m. The main underlying reason for this was a 19.2% decline in closing prices for new developments. Resale homes, on the other hand, remained very stable. This price decline in the new development market is also accompanied by a 36.7% decline in closed sales. The reason for this drastic decline is that legacy development contracts are drawing to a close with very few new ones coming on the market.
The number of closed sales were down across the board, with condo sales down over 20% and co-ops down over 13%. On the opposite side of the declining demand side is a significantly increasing supply with an inventory rise of 10.7%. This has resulted in an eight-year high inventory total.
The overall result is the lowest rate of bidding wars since 2012, which marks a great opportunity for investment as negotiations are more straightforward. Properties are now available in highly desirable areas which have been inaccessible for several years.
Brooklyn
Unlike Manhattan, median price declines in Brooklyn have been relatively small at -1.9% to $984,000. With prices still about 50% higher than their pre-2008 crisis levels, this is still proving to be an extremely hot market. At the same time, there have been signs of a trend reversal. Total days on the market for all properties has increased by 14 days year over year. However, the majority of the increase has come since Q1 of this year with quite a large spike from 84 days to 107.
The number of total closed sales is down 5.7% while at the same time inventory numbers are up over 18.5%. This significant shift in the balance of supply and demand could lead to many opportunities to snap up properties in a very sought-after area.
Most of the above downward trend in sales and prices is seen in the multi-family market including condos and co-ops, while the single-family data is still holding stable to slightly increasing trends. For investors looking for single-family opportunities, the good news is that the supply side is up over 50%, meaning there is more availability in a larger range of prices.
Queens
Queens is the main NY borough that has shown a significant increase in median prices of 11.6% year over year to $629,000. These prices in all areas and across all property types are at or very close to record highs. The total number of listings is up 8.9% year over year, but what’s more interesting is the 16% increase since Q1 alone. On the demand side, closed sales were down 6.5% year over year. However, in the last quarter, that trend has been reversing with a 3.6% increase in sales.
This shows that demand for properties across Queens is still very high with a moderate increase in available listings. While the increased number of properties is positive for buyers, the high demand is still making it difficult for investors to find great deals.
Practically all of the price rises are coming from single family homes as well as new developments, with condos and co-ops showing the largest declines in sales. From an investment point of view that would make the multi-unit properties a possible better opportunity.
Westchester County
The trends in Westchester County are somewhat unique when compared to the above boroughs. Prices are up 5% to $676,000 but the total number of closed sales are down 17.7% and inventory levels year over year have remained stable.
The main reason for the price increases in a negative demand and stable inventory environment comes from the fact that since Q1 2018 closed sales are up a huge 28.9%. That closer view of quarterly data says a lot about potential trends in this county.
Overall, prices are barely at pre-2008 crisis levels. However, it’s also important to note that post-crisis prices in Westchester did not see the same fall as elsewhere. The majority of demand is still in the single-family home market where prices are rising compared to a slight drop in the price of condos. Total sales also remained significantly higher for single-family units.
While the overall level price stability of the past 10 years is not ideal from an investment perspective, Westchester remains a very popular place for young families to rent. This provides for a great rental market of young professionals.
Nassau County
The trend data for Nassau County is overall very similar to that of Long Island in general. Median prices for the more popular North Shore are up 7.7% while South Shore is up 3.4%. The interesting thing about these trends though is in the numbers since Q1. North Shore data shows that median sales prices since the first quarter are up 12.9%, which means that this area is significantly hotter.
With pre-2008 crisis prices only exceeded last year, current median prices of about $500,000 for the county as a whole are still very close to record levels. Year over year listings are up right around 5%, but again, since Q1 those figures have jumped to 35.9% for North Shore and 17.6% for South Shore. The accompanying increase in closed sales has maintained this upward trend in prices.
Conclusion
New York overall remains a market with huge potential in many areas. While places like Manhattan and Brooklyn are showing signs of some trend reversals, these are times where just the right type of investment can be found to improve a portfolio.
Data Sources:
- Manhattan: https://www.elliman.com/pdf/63978c27e625f9367e8bfd8f0e026d01cf805609
- Brooklyn: https://www.elliman.com/pdf/1819a33cf5a75996b141a6d0adbb0ce27753daa2
- Queens: https://www.elliman.com/pdf/c632c854e132373edefd7a8a3a2d27510683b84c
- Westchester: https://www.elliman.com/pdf/bf85ea1e1706a6984bd19af7b961d386fbbdba2c
- Nassau: https://www.elliman.com/pdf/ec806b6948ef91e1cd97749b8da02eb35d847c43


