The good news is that the U.S. home flipping market continues to recover, and raw profits rose to near-record levels. The downside is that profit margins dipped to their lowest point since early 2009. In this article, we look at the overall market and identify the top 10 fix and flip markets. We also provide insight into what to look for in any market.
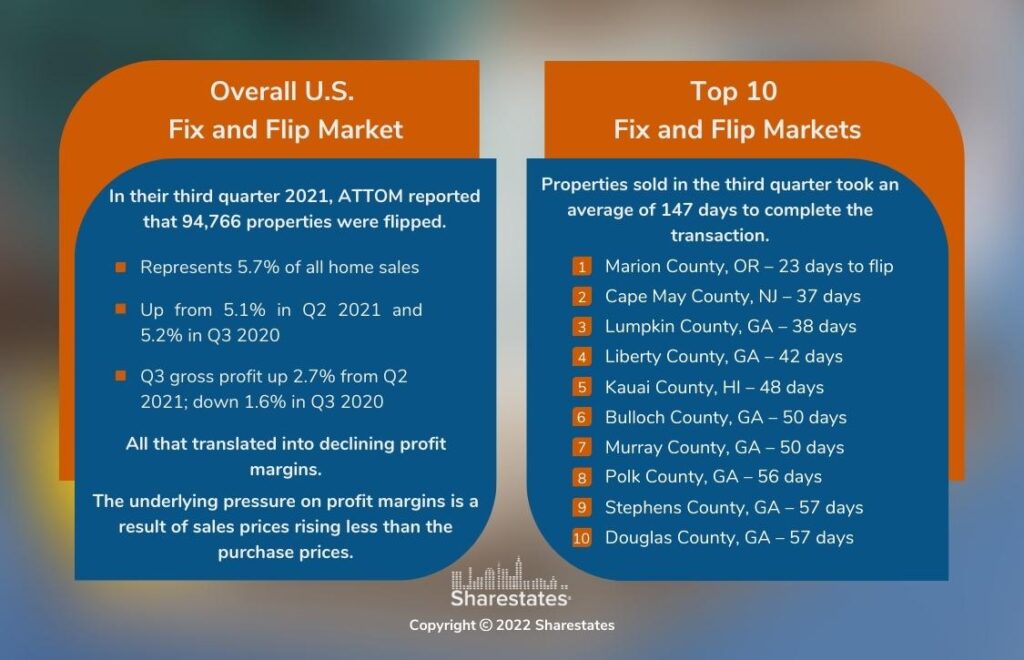
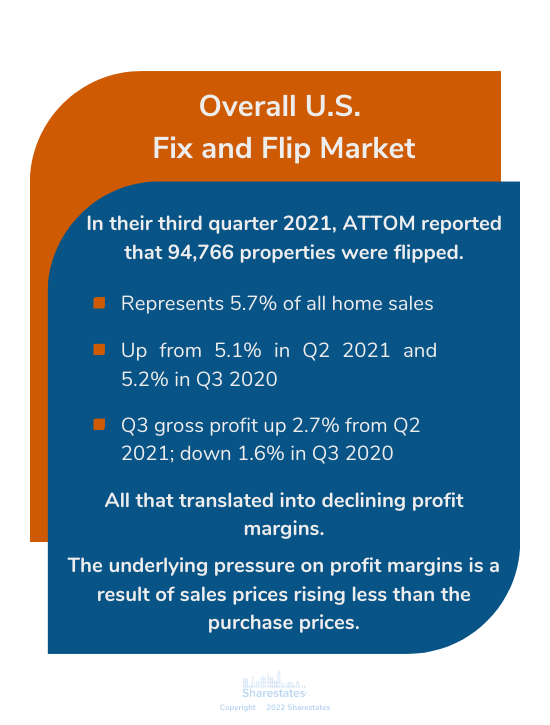
In their third quarter 2021 home flipping report ATTOM, the real estate data provider, reported that 94,766 properties were flipped. That represented 5.7% of all home sales. That’s up from 5.1% in the second quarter and up from 5.2% in the third quarter 2020.
They reported that gross profit (median sales price minus median paid price) moved to $68,847 in the third quarter. This is up 2.7% from $67,008 in the second quarter 2021 but down 1.6% from the $70,000 in the third quarter 2020.
All that translated into declining profit margins. Third quarter 2021 came in at 32.3% ROI compared to the original acquisition price. Second-quarter 2021 was at 32.2% but third quarter 2020 was at 43.8%. This is the largest annual drop since early 2009.
The median price of homes flipped in the third quarter set a record at $281,847. This is up 4.8% from the second quarter and 22.5% from a year earlier. While those rising prices make great headlines the underlying pressure on profit margins is a result of sales prices rising less than the purchase prices.
Top 10 Fix and Flip Markets
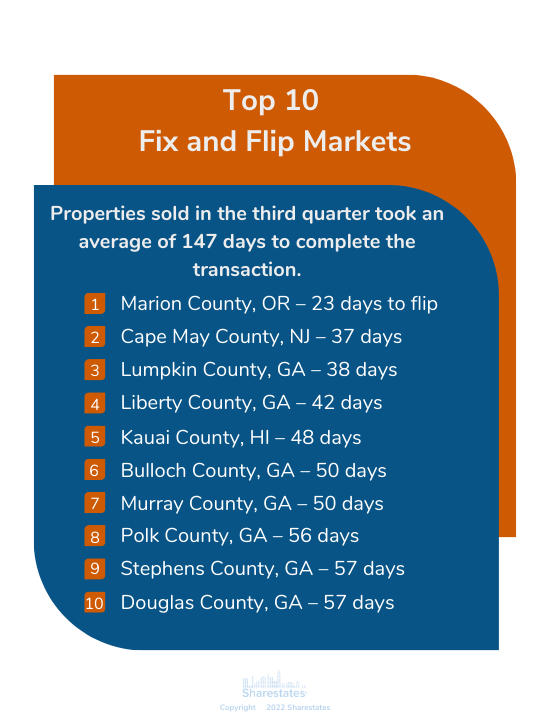
Another interesting statistic is that properties sold in the third quarter took an average of 147 days to complete the transaction. This is the shortest turnaround time since the third quarter 2010. More recently, second quarter 2021 was at 148 days, and third quarter 2020 at 189 days.
We used ATTOM’s third quarter home flipping report to identify the top 10 fix and flip markets based on the shortest average time to flip a home.
- Marion County, OR — 23 days to flip
- Cape May County, NJ — 37 days
- Lumpkin County, GA — 38 days
- Liberty County, GA — 42 days
- Kauai County, HI — 48 days
- Bulloch County, GA — 50 days
- Murray County, GA — 50 days
- Polk County, GA — 56 days
- Stephens County, GA — 57 days
- Douglas County, GA — 57 days
Of course, there are as many ways to examine a top 10 market as there are real estate statistics. The top 10 chart below provides the ranking based on the highest home flipping rates in the third quarter of 2021.
- Camden County, NC — 15.9%
- Lumpkin County, GA — 15.1%
- Logan County, KY — 14.7%
- Canadian County, OK — 14.4%
- Adams County, OH — 13.4%
- Iberville County, LA — 12.5%
- McCurtain County, OK — 12.5%
- Palo Pinto County, TX — 12.4%
- Fannin County, GA — 12.2%
- Dekalb County, TN — 12.1%
Keys to a Strong Fix and Flip Market
The big key is having ready buyers for the properties you buy, improve, and sell. Given that, in your analysis of any market look for the number of real estate agents to help make the sale. You’ll also need to examine the available mortgage lenders for potential buyers. And don’t forget to include the available contractors and their rates as well as availability to help with remodeling.
Neighborhood qualities should also be a factor. You may get an excellent purchase price but if no one wants to live in the neighborhood, there won’t be a profitable sale. Look for school quality, crime statistics, parks/recreation, restaurants, and hospitals. It is also wise to examine job opportunities that can attract buyers.
We hope this brief analysis has helped. To learn more about getting funding for your fix and flip business through Sharestates, click here
